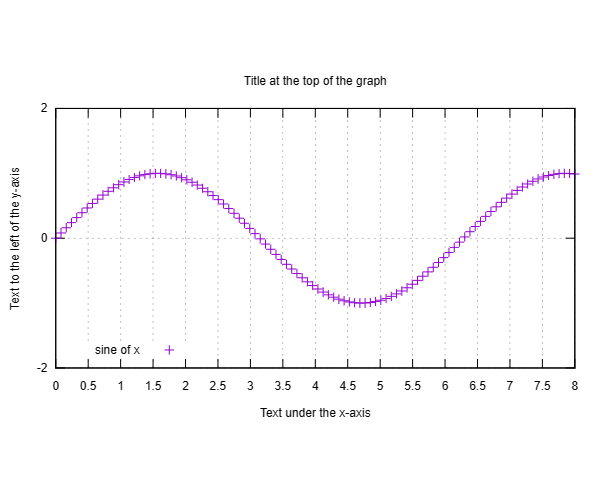
set title 'Title at the top of the graph' #graph title
set xlabel 'Text under the x-axis' #horizontal axis label
set ylabel 'Text to the left of the y-axis' #vertical axis label
set xtics 0.5 #distance between tics on x-axis
set ytics 2.0 #distance between tics on y-axis
set key bottom left #legend position
set size ratio 0.5 #graph ratio (half height)
set xrange[0:8] #range of the x-axis
set grid #sets the grid in both directions
plot sin(x) with p title 'sine of x' #title here goes into the legend