set xtics 1
set ytics 0.5
set xrange [2016:2024] #extra range to have padding
set yrange [10:21] #extra range to have padding
set key bottom right #change legend location
#default font is Arial,12
#tc (textcolor) is '#RRGGBB' or a color name like 'red'
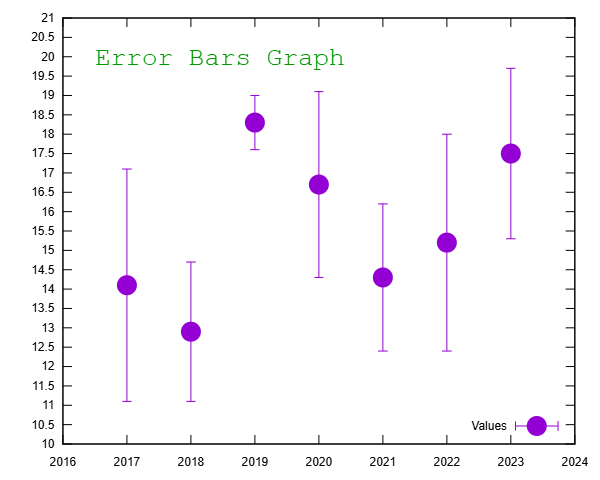
set label 1 'Error Bars Graph' at 2016.5,20 font 'Courier,26' tc rgb '#009900'
#errorbar plots need 3 columns x-axis:y-axis:error
#pt 7 is filled circle
plot 'gnup10.txt' using 1:2:3 with errorbars title 'Values' ps 2 pt 7