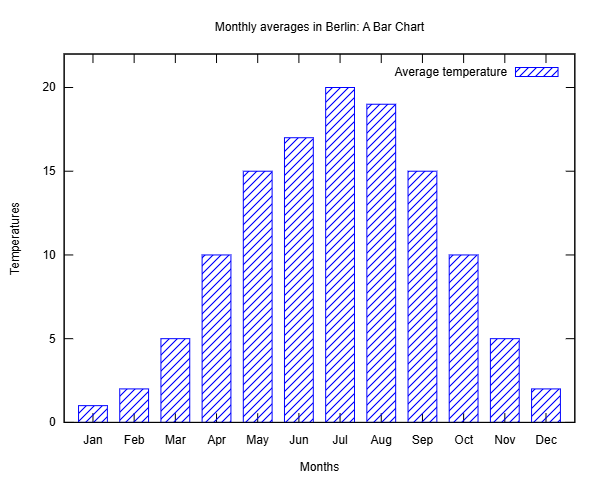
set title 'Monthly averages in Berlin: A Bar Chart'
set xlabel 'Months'
set ylabel 'Temperatures'
set boxwidth 0.7
set yrange [0:22]
#default fill pattern is 'empty'
#other fill options are solid (with optional density) or pattern numbers
set style fill pattern 5
#lc (linecolor) is '#RRGGBB' or a colour name like 'blue'
#2:xtic(1) to plot column 2 for values with column 1 as tics for the x-axis
plot 'gnup11.txt' using 2:xtic(1) with boxes lc 'blue' title 'Average temperature'