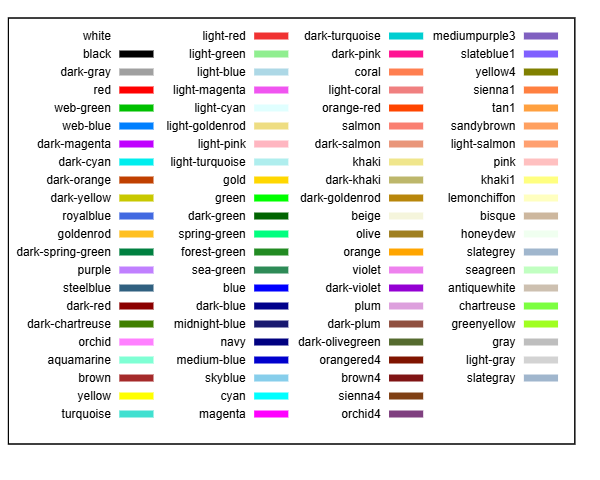
#the list of gnuplot colours
colours ="\
white black dark-gray red web-green web-blue dark-magenta dark-cyan \
dark-orange dark-yellow royalblue goldenrod dark-spring-green \
purple steelblue dark-red dark-chartreuse orchid aquamarine brown \
yellow turquoise light-red light-green light-blue \
light-magenta light-cyan light-goldenrod light-pink light-turquoise \
gold green dark-green spring-green forest-green sea-green blue \
dark-blue midnight-blue navy medium-blue skyblue cyan magenta \
dark-turquoise dark-pink coral light-coral orange-red salmon \
dark-salmon khaki dark-khaki dark-goldenrod beige olive orange \
violet dark-violet plum dark-plum dark-olivegreen orangered4 brown4 \
sienna4 orchid4 mediumpurple3 slateblue1 yellow4 sienna1 tan1 \
sandybrown light-salmon pink khaki1 lemonchiffon bisque honeydew \
slategrey seagreen antiquewhite chartreuse greenyellow gray light-gray \
slategray"
#showing keys only instead of a graph
#samplen is the length of the sample, width to adjust between the columns
set key samplen 3 width -7
#setting the plot area (border, ranges, margins, tics) to make it look better
set border lw 1
set xrange [-20:20]
set yrange [-2:2]
set lmargin 1
set bmargin 2
unset tics
#plotting the colour samples
#using 1 is the same as using 0:1
plot for [c in colours] '+' using 1 with lines title c lw 7 lc rgb c